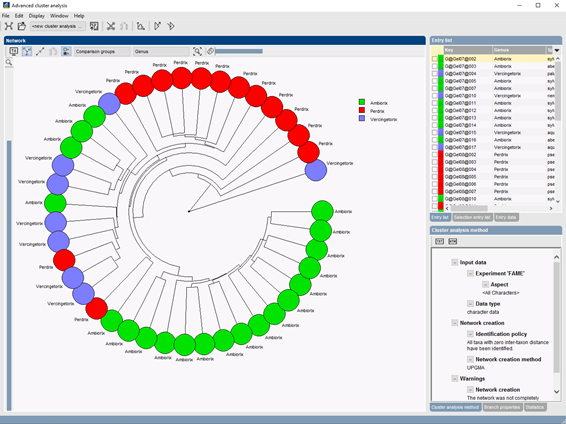
In the Advanced cluster analysis window, a dendrogram layout option is available that allows you to create a circular dendrogram of your data.

Flexible dendrogram display settings
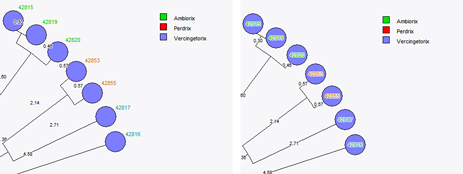
Adjustments to taxon and label colors can be specified and moreover, the phylogenetic tree can be annotated with various types of data available in the BIONUMERICS database.
The existing display settings are extended to show node labels on top of the nodes or simply next to them.

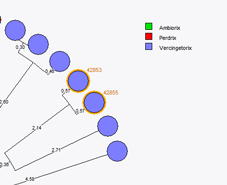
 Selections are synchronized within the BIONUMERICS program, allowing you to select and quickly identify selected entries in other analysis windows in BIONUMERICS.
Selections can also be used to restrict the displayed information on the dendrogram to the selected entries only.
Cluster analysis templates and export
 Once the desired visualization is created, the analysis template including layout options can be saved and shared within the database or exchanged by XML files between coworkers.
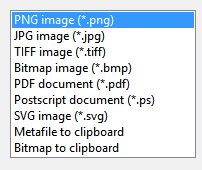
Figures can be exported in high quality WYSIWYG vector and bitmap graphic formats.
