Cluster analysis, also called unsupervised learning, is an indispensable tool in bioinformatics. BIONUMERICS brings together the power and flexibility of its relational database, the contribution of multiple techniques, and a wide range of clustering algorithms in a clustering module with unique capabilities.
The Comparison window in BIONUMERICS
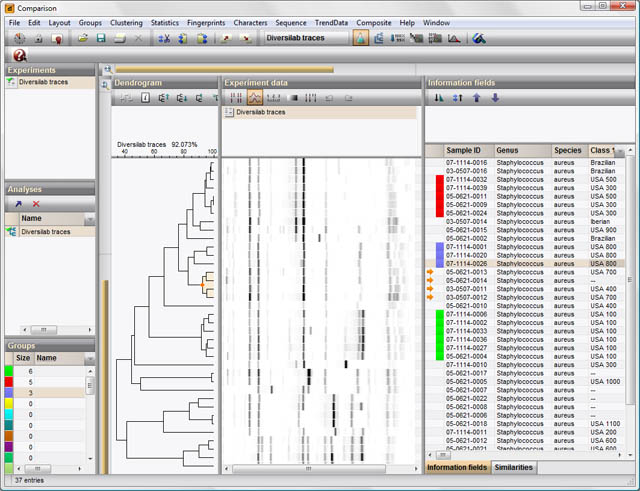
 The heart of BIONUMERICS' analysis functions is the Comparison window, presenting a comprehensive overview of all available experiments for a selection of entries and enabling the user to show and compare any combination of experiments. Similarity or distance matrices and dendrograms can be calculated for any selected experiment, and the obtained groupings can be compared with patterns or characters obtained from other experiments. A large number of similarity and distance coefficients and clustering methods are available, in order to provide the most appropriate clustering for all data types and clustering purposes.
Dendrogram features
Interpreting trees of up to 20,000 entries is not a simple task. BIONUMERICS offers a comprehensive set of features for interpreting and mining of complex data sets, including viewing tools such as two-way zoom-sliders, swapping and abridging of branches, rerooting of trees, displaying data (characters, patterns, curves or sequences) in various modes, assigning colors or symbols to groups, etc. Furthermore, adding entries to, or deleting entries from large clusterings is facilitated using the incremental clustering feature. Rather than recalculating matrices and trees, BIONUMERICS automatically updates, so that adding or deleting entries becomes a matter of a few seconds.
Publishing options
The comparison window has numerous edit options and offers enhanced publishing and printing facilities in a WYSIWYG environment. All features of a comparison can be stored to disk.
Cluster analysis based on pairwise similarities
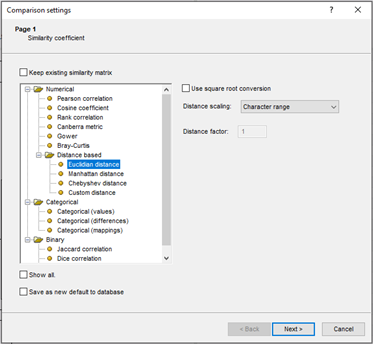
BIONUMERICS allows the calculation of pairwise similarity values and a cluster analysis from up to 20,000 database entries for any type of experiment. Various similarity and distance coefficients are available for different data types, for example:
Cluster significance tools
In addition to standard methods such as bootstrap analysis or cophenetic correlation, BIONUMERICS employs proprietary technology to assess the reliability of clusters for any clustering algorithm and data set. The method is based on resampling/permutation techniques operating at the data level or at the similarity level and is designed as a framework encompassing all available clustering algorithms in BIONUMERICS.
Composite clustering
Data from multiple techniques can be combined into one composite clustering. Similarities can be adopted from the individual experiments and averaged using different weighting strategies. Alternatively, all characters from the individual experiments can be pooled to form one global data set, which can be clustered. Using a mathematical linearization model, a consensus similarity matrix and dendrogram can be calculated based upon individual matrices from different experiments.
Congruence between techniques
Global similarities or congruence between different typing methods or taxonomic techniques can be calculated and displayed as a similarity matrix or dendrogram. The taxonomic depth or level of each technique can be visualized by pairwise regression plots of similarity values.
Minimum Spanning Trees
Phylogenetic tree construction
BIONUMERICS offers phylogenetic tree construction methods such as Maximum Parsimony and Maximum Likelihood. Besides standard algorithms, the optimal trees can be calculated using simulated annealing or quartet puzzling. Both methods result in an unrooted tree, which can be converted into a rooted tree after assignment of a root. To correct phylogenetic distance scaling, the Jukes & Cantor or Kimura 2 parameter correction factors can be chosen.